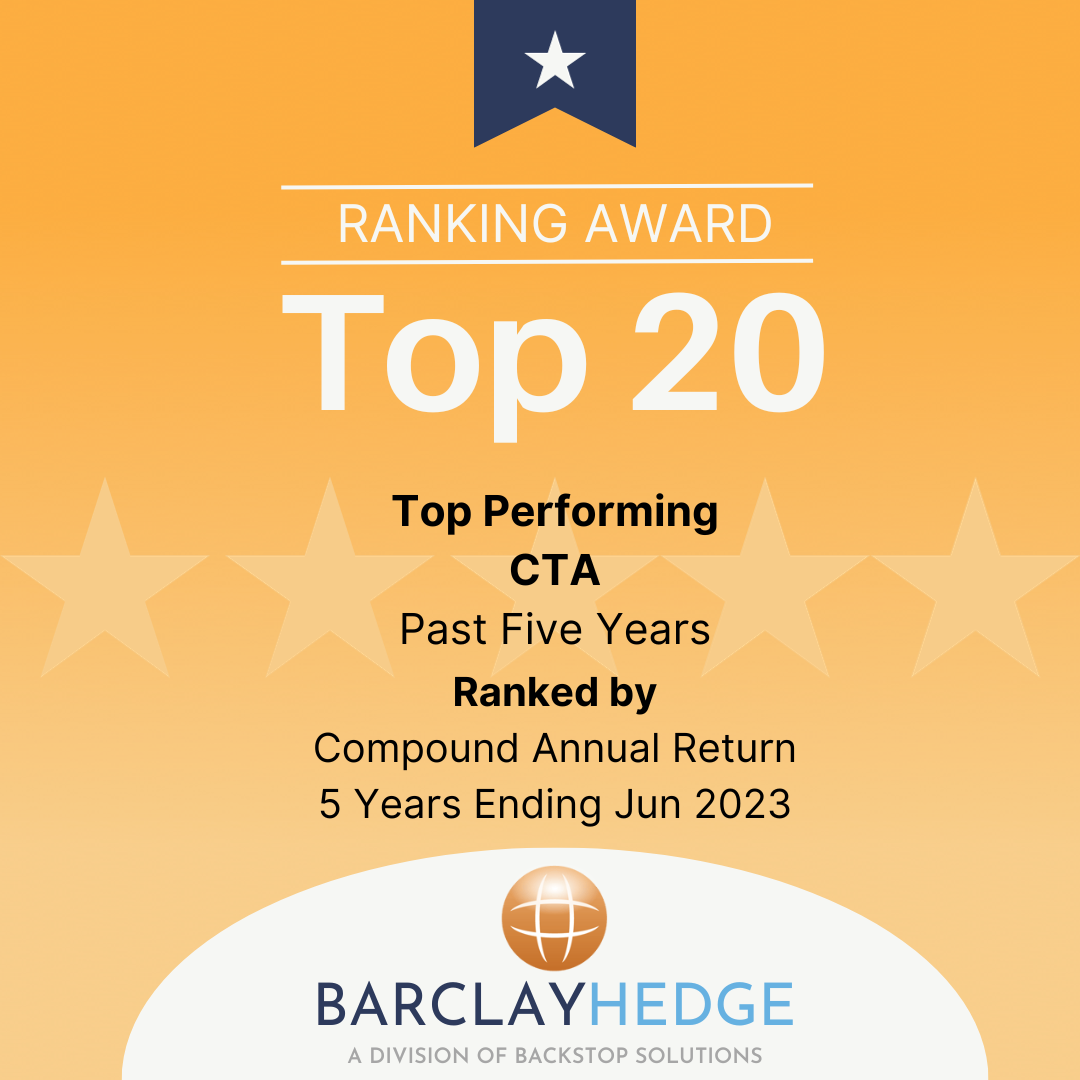

Our Expertise
Our expertise is in currency trading and we trade the ten most common currencies, known as the G10. The most traded spot currency pairs are major and minor crosses which include AUD, CAD, EUR, GBP, JPY, NZD and USD. In addition to these pairs, spot gold (XAUUSD) is also traded regularly. Cryptocurrencies are not traded.
Fee Structure
All returns and statistics are presented net of fees. Our fee structure is as follows:
Management Fee: 2 %
Performance Fee: 20 %
Highwater Mark: Yes
Alternative 1
september 2026
Quick facts
The capital managed by the Alternative 1.
Trading started in January 2018.
Shows the strategy’s best and worst full-year results.
The number of positive months during the term.
Standard deviation is a measure of a fund's risk and reflects volatility, that is, the fluctuations in returns. The higher the standard deviation, the higher the risk. A low standard deviation means that the value of the fund has fluctuated less. For equity funds, a standard deviation below ten can be said to represent relatively low risk, while a standard deviation above twenty represents relatively high risk.
The Sharpe ratio is a measure used to assess the risk-adjusted return. It shows the relationship between the return you get and the risk you take when investing. As an investor, you can use the Sharpe ratio to get an idea of how well your investments are performing in relation to the risk you are taking. The higher the Sharpe ratio, the better. A Sharpe ratio of zero or lower is not good. For long-term savings, a Sharpe ratio above 0.5 is good, while a Sharpe ratio of 1 or higher is very good. The Sharpe ratio is a great metric for comparing investments to each other, as it takes into account fee, return and risk - all in a single figure. If you're only going to look at one number when evaluating an investment, it's the Sharpe ratio you should use.
Correlation describes the extent to which an investment moves in the same direction as an index such as the S&P 500. It is measured on a scale from -1 to +1, where +1 means they move almost identically, 0 means there is no correlation, and -1 means they move in opposite directions. An investment with a high correlation to the S&P 500 will therefore rise and fall roughly at the same time as the index. Low correlation means the investment behaves more independently, which can reduce risk in a portfolio. This is why investors use correlation to diversify risk and avoid having all investments affected equally at the same time.
Minimum initial investment
Fund ManagerRichard Corvenius |
 |
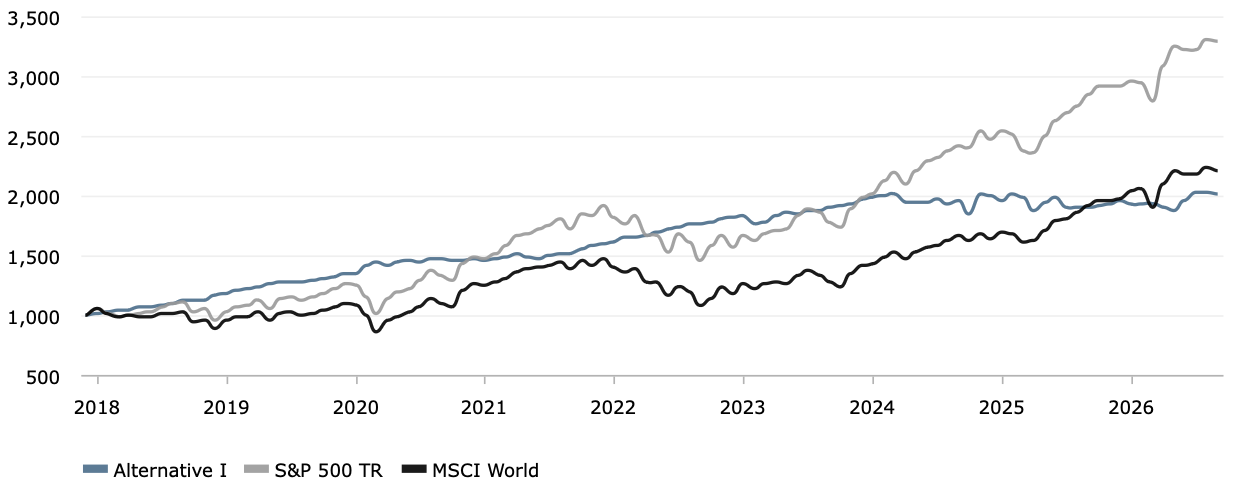
Click on the graph to enlarge the image
Risk information
Past performance is neither a guarantee nor an indication of future results or profits. Your investments may increase or decrease in value and it is never certain that you will recover all or part of your invested capital.
Ambitious
september 2026
Quick facts
The capital managed by the Ambitious.
Trading started in September 2023.
Shows the strategy’s best and worst full-year results.
The number of positive months during the term.
Standard deviation is a measure of a fund's risk and reflects volatility, that is, the fluctuations in returns. The higher the standard deviation, the higher the risk. A low standard deviation means that the value of the fund has fluctuated less. For equity funds, a standard deviation below ten can be said to represent relatively low risk, while a standard deviation above twenty represents relatively high risk.
The Sharpe ratio is a measure used to assess the risk-adjusted return. It shows the relationship between the return you get and the risk you take when investing. As an investor, you can use the Sharpe ratio to get an idea of how well your investments are performing in relation to the risk you are taking. The higher the Sharpe ratio, the better. A Sharpe ratio of zero or lower is not good. For long-term savings, a Sharpe ratio above 0.5 is good, while a Sharpe ratio of 1 or higher is very good. The Sharpe ratio is a great metric for comparing investments to each other, as it takes into account fee, return and risk - all in a single figure. If you're only going to look at one number when evaluating an investment, it's the Sharpe ratio you should use.
Correlation describes the extent to which an investment moves in the same direction as an index such as the S&P 500. It is measured on a scale from -1 to +1, where +1 means they move almost identically, 0 means there is no correlation, and -1 means they move in opposite directions. An investment with a high correlation to the S&P 500 will therefore rise and fall roughly at the same time as the index. Low correlation means the investment behaves more independently, which can reduce risk in a portfolio. This is why investors use correlation to diversify risk and avoid having all investments affected equally at the same time.
Minimum initial investment
Fund ManagerRobert J. Teuwissen |
 |
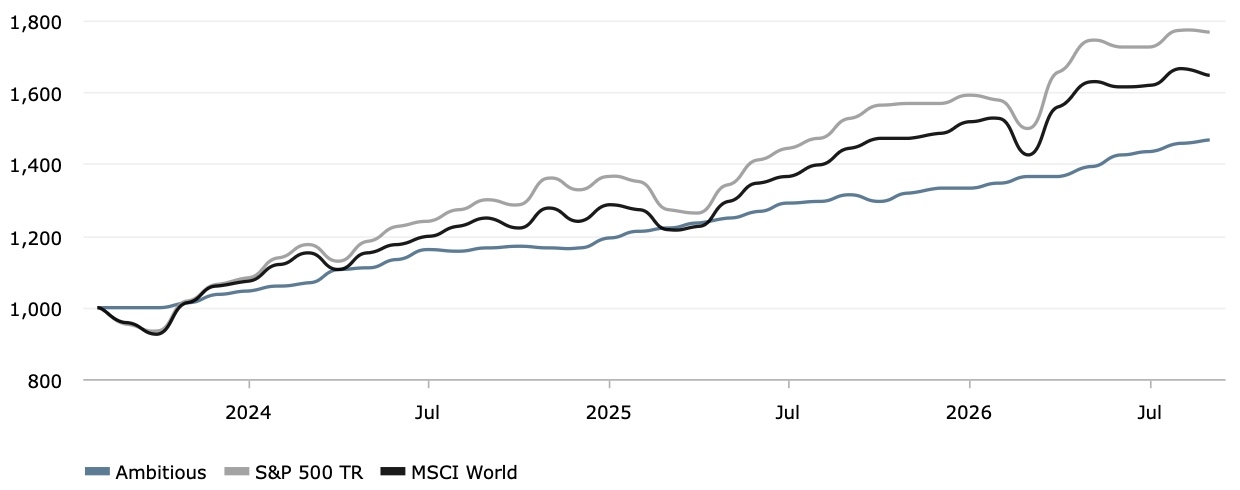
Click on the graph to enlarge the image
Risk information
Past performance is neither a guarantee nor an indication of future results or profits. Your investments may increase or decrease in value and it is never certain that you will recover all or part of your invested capital.
Currency Alpha
september 2026
Quick facts
The capital managed by the Currency Alpha strategy.
Trading started in March 2018.
Shows the strategy’s best and worst full-year results.
The number of positive months during the term.
Standard deviation is a measure of a fund's risk and reflects volatility, that is, the fluctuations in returns. The higher the standard deviation, the higher the risk. A low standard deviation means that the value of the fund has fluctuated less. For equity funds, a standard deviation below ten can be said to represent relatively low risk, while a standard deviation above twenty represents relatively high risk.
The Sharpe ratio is a measure used to assess the risk-adjusted return. It shows the relationship between the return you get and the risk you take when investing. As an investor, you can use the Sharpe ratio to get an idea of how well your investments are performing in relation to the risk you are taking. The higher the Sharpe ratio, the better. A Sharpe ratio of zero or lower is not good. For long-term savings, a Sharpe ratio above 0.5 is good, while a Sharpe ratio of 1 or higher is very good. The Sharpe ratio is a great metric for comparing investments to each other, as it takes into account fee, return and risk - all in a single figure. If you're only going to look at one number when evaluating an investment, it's the Sharpe ratio you should use.
Correlation describes the extent to which an investment moves in the same direction as an index such as the S&P 500. It is measured on a scale from -1 to +1, where +1 means they move almost identically, 0 means there is no correlation, and -1 means they move in opposite directions. An investment with a high correlation to the S&P 500 will therefore rise and fall roughly at the same time as the index. Low correlation means the investment behaves more independently, which can reduce risk in a portfolio. This is why investors use correlation to diversify risk and avoid having all investments affected equally at the same time.
Minimum initial investment
Fund ManagerRobert J. Teuwissen |
|
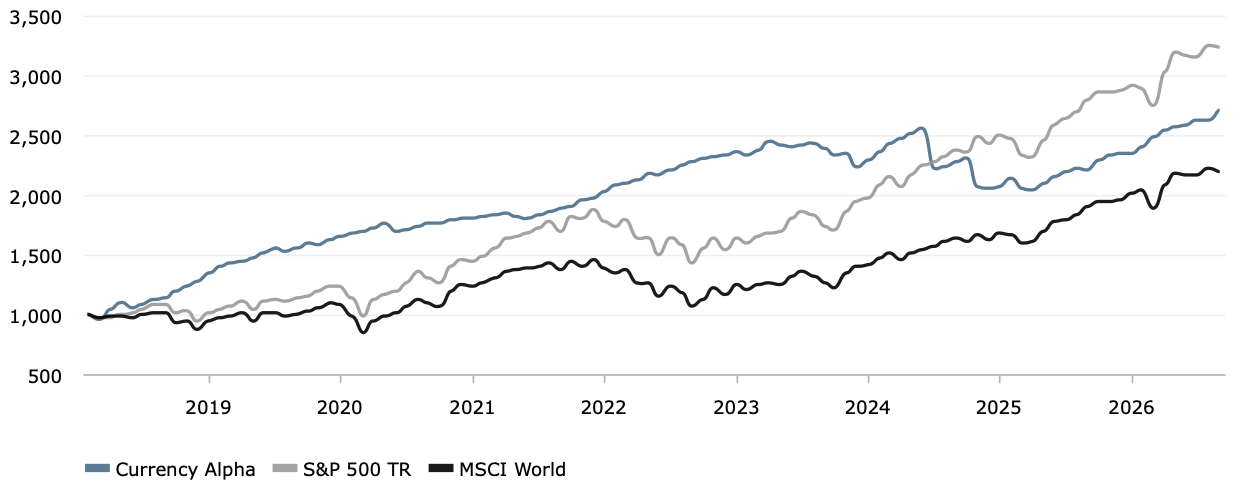
Click on the graph to enlarge the image
Risk information
Past performance is neither a guarantee nor an indication of future results or profits. Your investments may increase or decrease in value and it is never certain that you will recover all or part of your invested capital.
Currency Overlay
september 2026
Quick facts
The capital managed by the Currency Overlay.
Shows the strategy’s best and worst full-year results.
Trading started in March 2016.
The number of positive months during the term.
Standard deviation is a measure of a fund's risk and reflects volatility, that is, the fluctuations in returns. The higher the standard deviation, the higher the risk. A low standard deviation means that the value of the fund has fluctuated less. For equity funds, a standard deviation below ten can be said to represent relatively low risk, while a standard deviation above twenty represents relatively high risk.
The Sharpe ratio is a measure used to assess the risk-adjusted return. It shows the relationship between the return you get and the risk you take when investing. As an investor, you can use the Sharpe ratio to get an idea of how well your investments are performing in relation to the risk you are taking. The higher the Sharpe ratio, the better. A Sharpe ratio of zero or lower is not good. For long-term savings, a Sharpe ratio above 0.5 is good, while a Sharpe ratio of 1 or higher is very good. The Sharpe ratio is a great metric for comparing investments to each other, as it takes into account fee, return and risk - all in a single figure. If you're only going to look at one number when evaluating an investment, it's the Sharpe ratio you should use.
Correlation describes the extent to which an investment moves in the same direction as an index such as the S&P 500. It is measured on a scale from -1 to +1, where +1 means they move almost identically, 0 means there is no correlation, and -1 means they move in opposite directions. An investment with a high correlation to the S&P 500 will therefore rise and fall roughly at the same time as the index. Low correlation means the investment behaves more independently, which can reduce risk in a portfolio. This is why investors use correlation to diversify risk and avoid having all investments affected equally at the same time.
Minimum initial investment
Fund ManagerRobert Pritchard |
 |
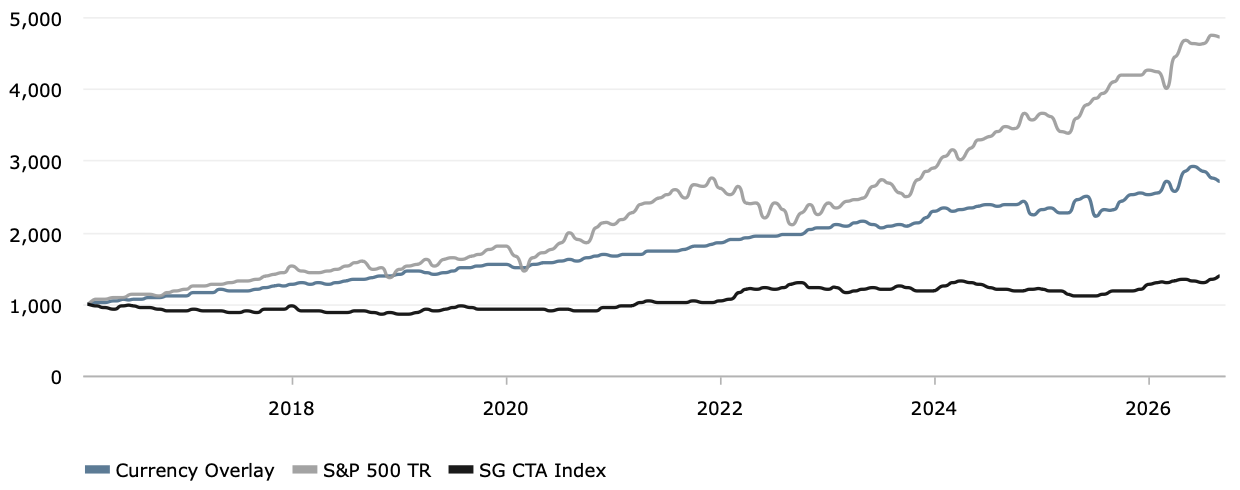
Click on the graph to enlarge the image
Risk information
Past performance is neither a guarantee nor an indication of future results or profits. Your investments may increase or decrease in value and it is never certain that you will recover all or part of your invested capital.
Opportunity
september 2026
Quick facts
The capital managed by the Opportunity.
Trading started in January 2024.
Shows the strategy’s best and worst full-year results.
The number of positive months during the term.
Standard deviation is a measure of a fund's risk and reflects volatility, that is, the fluctuations in returns. The higher the standard deviation, the higher the risk. A low standard deviation means that the value of the fund has fluctuated less. For equity funds, a standard deviation below ten can be said to represent relatively low risk, while a standard deviation above twenty represents relatively high risk.
The Sharpe ratio is a measure used to assess the risk-adjusted return. It shows the relationship between the return you get and the risk you take when investing. As an investor, you can use the Sharpe ratio to get an idea of how well your investments are performing in relation to the risk you are taking. The higher the Sharpe ratio, the better. A Sharpe ratio of zero or lower is not good. For long-term savings, a Sharpe ratio above 0.5 is good, while a Sharpe ratio of 1 or higher is very good. The Sharpe ratio is a great metric for comparing investments to each other, as it takes into account fee, return and risk - all in a single figure. If you're only going to look at one number when evaluating an investment, it's the Sharpe ratio you should use.
Correlation describes the extent to which an investment moves in the same direction as an index such as the S&P 500. It is measured on a scale from -1 to +1, where +1 means they move almost identically, 0 means there is no correlation, and -1 means they move in opposite directions. An investment with a high correlation to the S&P 500 will therefore rise and fall roughly at the same time as the index. Low correlation means the investment behaves more independently, which can reduce risk in a portfolio. This is why investors use correlation to diversify risk and avoid having all investments affected equally at the same time.
Minimum initial investment
Fund ManagerRobert Pritchard |
|
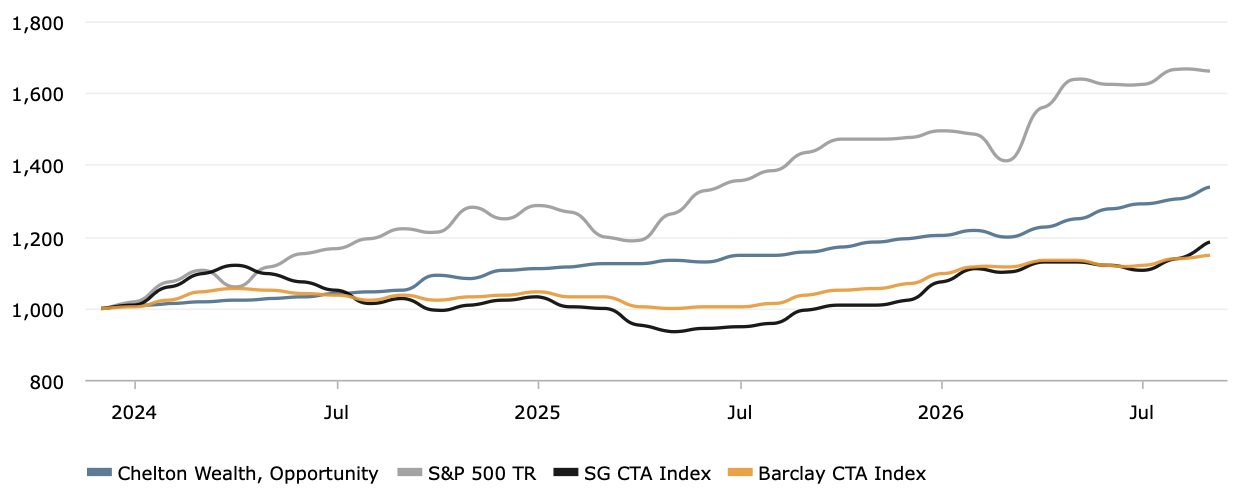
Click on the graph to enlarge the image
Risk information
Past performance is neither a guarantee nor an indication of future results or profits. Your investments may increase or decrease in value and it is never certain that you will recover all or part of your invested capital.